Last Updated: 4/7/2026
System Architecture & Project Structure
“Where Did They Go?” is built as a modern web application using Vue 3 for the frontend and Node.js/Express for the backend. This article explains the system architecture using the C4 model (Context, Container, Component) and describes the project’s directory structure.
C4 Model Overview
The C4 model provides a hierarchical view of software architecture, starting from the high-level system context and drilling down into containers and components. This project uses three levels of C4 diagrams to document its architecture.
System Context Diagram
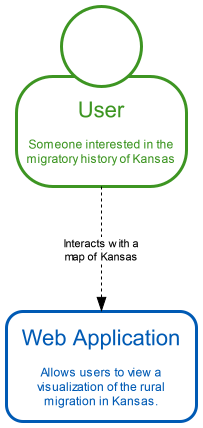
What This Diagram Shows
The System Context diagram shows “Where Did They Go?” as a single system and its relationship to external actors. The application serves two primary user groups:
Students — K-12 students exploring Kansas history, geography, and demographic changes as part of their coursework. Students interact with the map interface to visualize population trends and infrastructure development.
Teachers — Educators who use the application as a teaching tool in social studies, history, or geography lessons. Teachers guide students through the interface and use the visualizations to support curriculum objectives.
Key architectural decision: The system operates as a standalone web application with no external API dependencies. All data is pre-processed and served as static JSON/GeoJSON files, ensuring the application works reliably without requiring third-party services or API keys.
Container Diagram
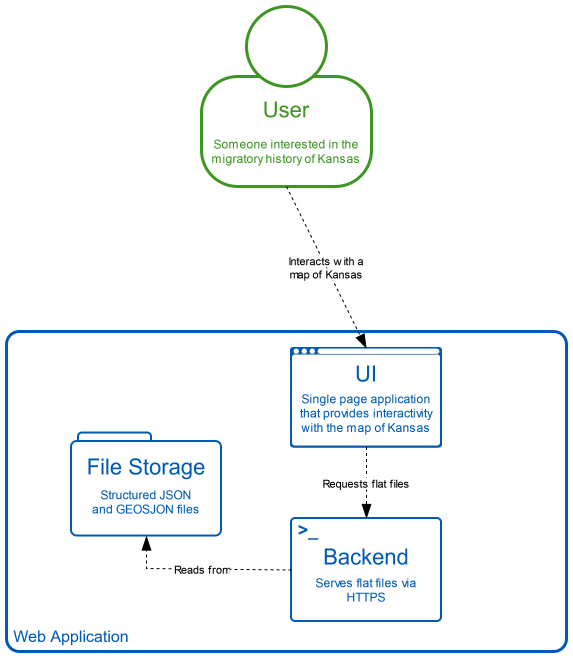
What This Diagram Shows
The Container diagram breaks the system into three major containers:
UI (Vue 3 Single-Page Application) — The frontend runs entirely in the user’s web browser. Built with Vue 3, it provides an interactive SVG-based map using D3.js for geographic projections and data visualization. The UI communicates with the backend only to fetch static data files.
Backend (Express Server) — A lightweight Node.js/Express server that serves the initial HTML page and provides static file access to JSON/GeoJSON datasets. The backend does NOT implement REST API endpoints or dynamic data processing—it functions purely as a file server with compression middleware.
File Storage (JSON/GeoJSON Files) — Pre-processed geographic and demographic data stored as static files in the server/public/ directory. Files are organized by state (currently only Kansas) and data type (geojson/, json/, csv/). The frontend fetches these files directly using standard HTTP requests.
Important note: A PostgreSQL database container exists in the development environment but is NOT currently used by the application logic. The database is reserved for future features but does not participate in the current data flow.
Ports:
- Client (development):
http://localhost:5173 - Server:
http://localhost:3000
Component Diagram
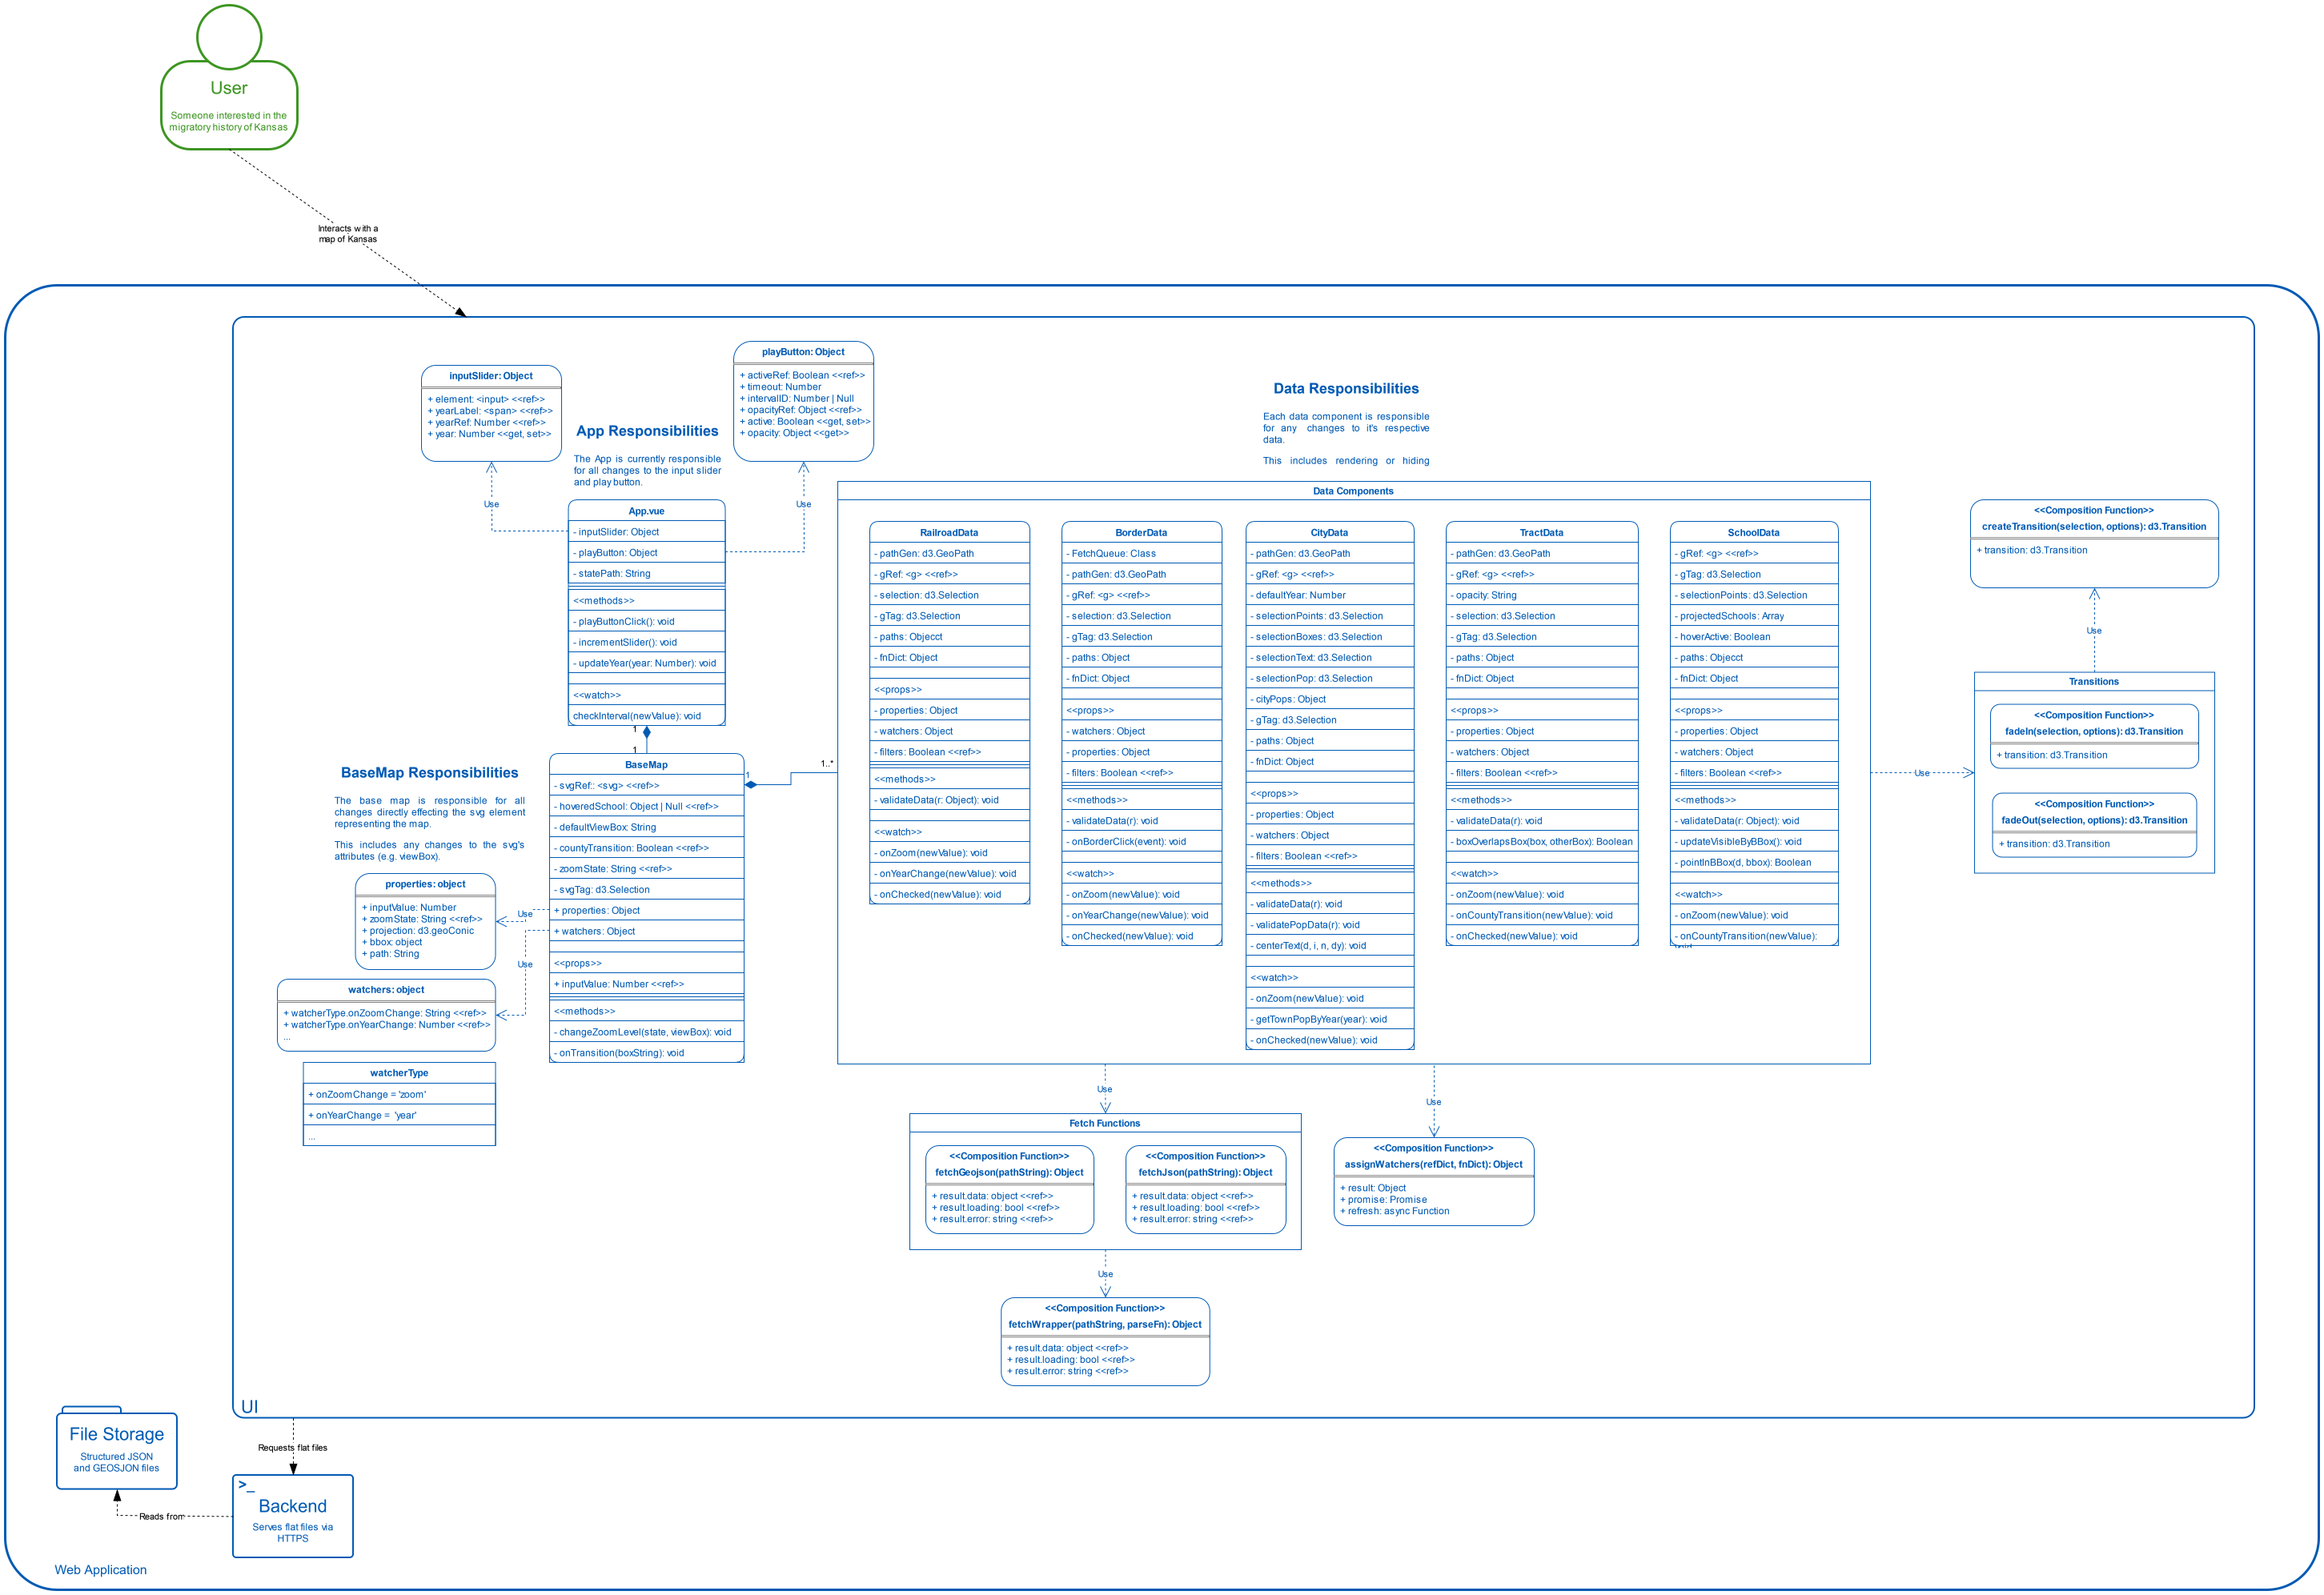
What This Diagram Shows
The Component diagram zooms into the Vue 3 UI container to show its internal structure:
App.vue (Timeline & Playback Controller) — The root component manages the timeline slider and play/pause button. It maintains the current year as reactive state and passes this value to BaseMap. The play button automatically advances the timeline every 3.5 seconds when active.
BaseMap.vue (Map Container & Registration API) — The central orchestrator component that:
- Renders the SVG container for all map visualizations
- Provides a registration API (via Vue’s
provide/inject) that data components use to register themselves - Manages the filter panel UI, showing/hiding filters based on zoom level
- Tracks map state (zoom level, current year, selected county)
- Invokes hooks to notify data components of state changes
- Handles county click events to transition between State View and County View
Data Components (9 Layers) — Each data layer is implemented as a separate Vue component:
- BorderData.vue — County boundaries and optional population heat map
- CityData.vue — City locations, names, and population labels
- RailroadData.vue — Railroad lines with construction year filtering
- InterstateData.vue — Interstate highways with opening year filtering
- RiverData.vue — River and waterway lines
- LakeData.vue — Lake and reservoir polygons
- SchoolData.vue — School building locations with hover tooltips
- HealthcareData.vue — Healthcare facility symbols with hover tooltips
- TractData.vue — Census tract boundaries
Each data component:
- Injects the
registerKeyto access BaseMap’s registration API - Calls
registerComponent(label, options)to register itself and receive hooks - Subscribes to hooks (
onYearChange,onZoomChange,onCountyTransition) to react to map state changes - Fetches its data using
fetchGeojson()orfetchJson()utility functions - Renders its visualization to the SVG using D3.js
Project Structure
The repository is organized into distinct directories for frontend, backend, testing, documentation, and development environment configuration:
client/
The Vue 3 frontend application. Key subdirectories:
**src/components/**— Vue components, including BaseMap.vue and all nine data layer components**src/enums/**— TypeScript-style enums (MapZoomLevel, HookType, GroupType) that define constants used across components**src/utility/**— Utility functions including fetchers.js (data loading), RegisterKey.js (registration API types), and interpolators (color calculations)**src/d3/**— D3.js helper functions for transitions and animations**src/__tests__/**— Frontend unit tests
server/
The Node.js/Express backend. Key subdirectories:
**public/**— Static files served to the frontend, organized by state (e.g.,public/kansas/geojson/,public/kansas/json/)**routes/**— Express route handlers (currently only renders the index page)**app.js**— Express application configuration with static file serving and compression middleware**bin/**— Server startup script
.devcontainer/
Docker Dev Container configuration for consistent development environments:
**devcontainer.json**— VS Code Dev Container settings**docker-compose.yml**— Multi-container setup (client, server, database)**Dockerfile**— Container image definition**postCreateCommand.sh**— Runs after container creation to install dependencies**postAttachCommand.sh**— Runs when attaching to the container to start services
documentation/
Project documentation and design artifacts:
**c4-diagrams/**— SVG files for System Context, Container, and Component diagrams**Requirements and Design Ideas.docx**— Original project requirements document
tests/
Testing resources and test data files for both frontend and backend.
Data Flow
- User opens the application in their browser
- Express server sends the initial HTML page
- Vue 3 application loads and mounts
- BaseMap.vue renders and provides the registration API
- Each data component registers itself and subscribes to hooks
- Data components fetch their JSON/GeoJSON files from the server
- Components render their data to the SVG using D3.js
- User interactions (timeline changes, county clicks, filter toggles) trigger hook callbacks
- Components update their visualizations in response to hook invocations
No REST API: The backend never processes requests for dynamic data. All data transformations and filtering happen in the browser using JavaScript.
Technology Stack
Frontend:
- Vue 3 (Composition API with
<script setup>) - D3.js (geographic projections, SVG rendering)
- JavaScript (no TypeScript, but JSDoc comments provide type hints)
Backend:
- Node.js
- Express (with compression middleware)
- Static file serving only
Development:
- Docker Dev Containers
- VS Code (recommended IDE)
Data Formats:
- GeoJSON (geographic features with properties)
- JSON (tabular data like city populations)
What’s Next
- Adding A Data Component – Step-by-step guide for developers implementing a new map layer
- Basemap Hook System – Technical deep-dive into the registration API and hook mechanism
- Data Layers Reference – User-facing documentation of all nine data layers